Monitoring a homelab shouldn’t require a PhD in observability pipelines. Yet somehow, we all end up with a rat’s nest of exporters, agents, and databases that barely talk to each other. After years of fighting this complexity, I’ve landed on the OpenTelemetry Collector as the single tool that ties everything together.
ClickHouse is the other piece of the puzzle here. I’m definitely biased since I work with ClickHouse daily at my job, but if you look under the hood of just about any modern observability platform from the last few years, you’ll probably find a little ClickHouse in there. For me, it provides a unified platform that can store all of my telemetry signals alongside other types of events - a one-stop shop for “real-time” analytics.
What Are We Monitoring? Link to heading
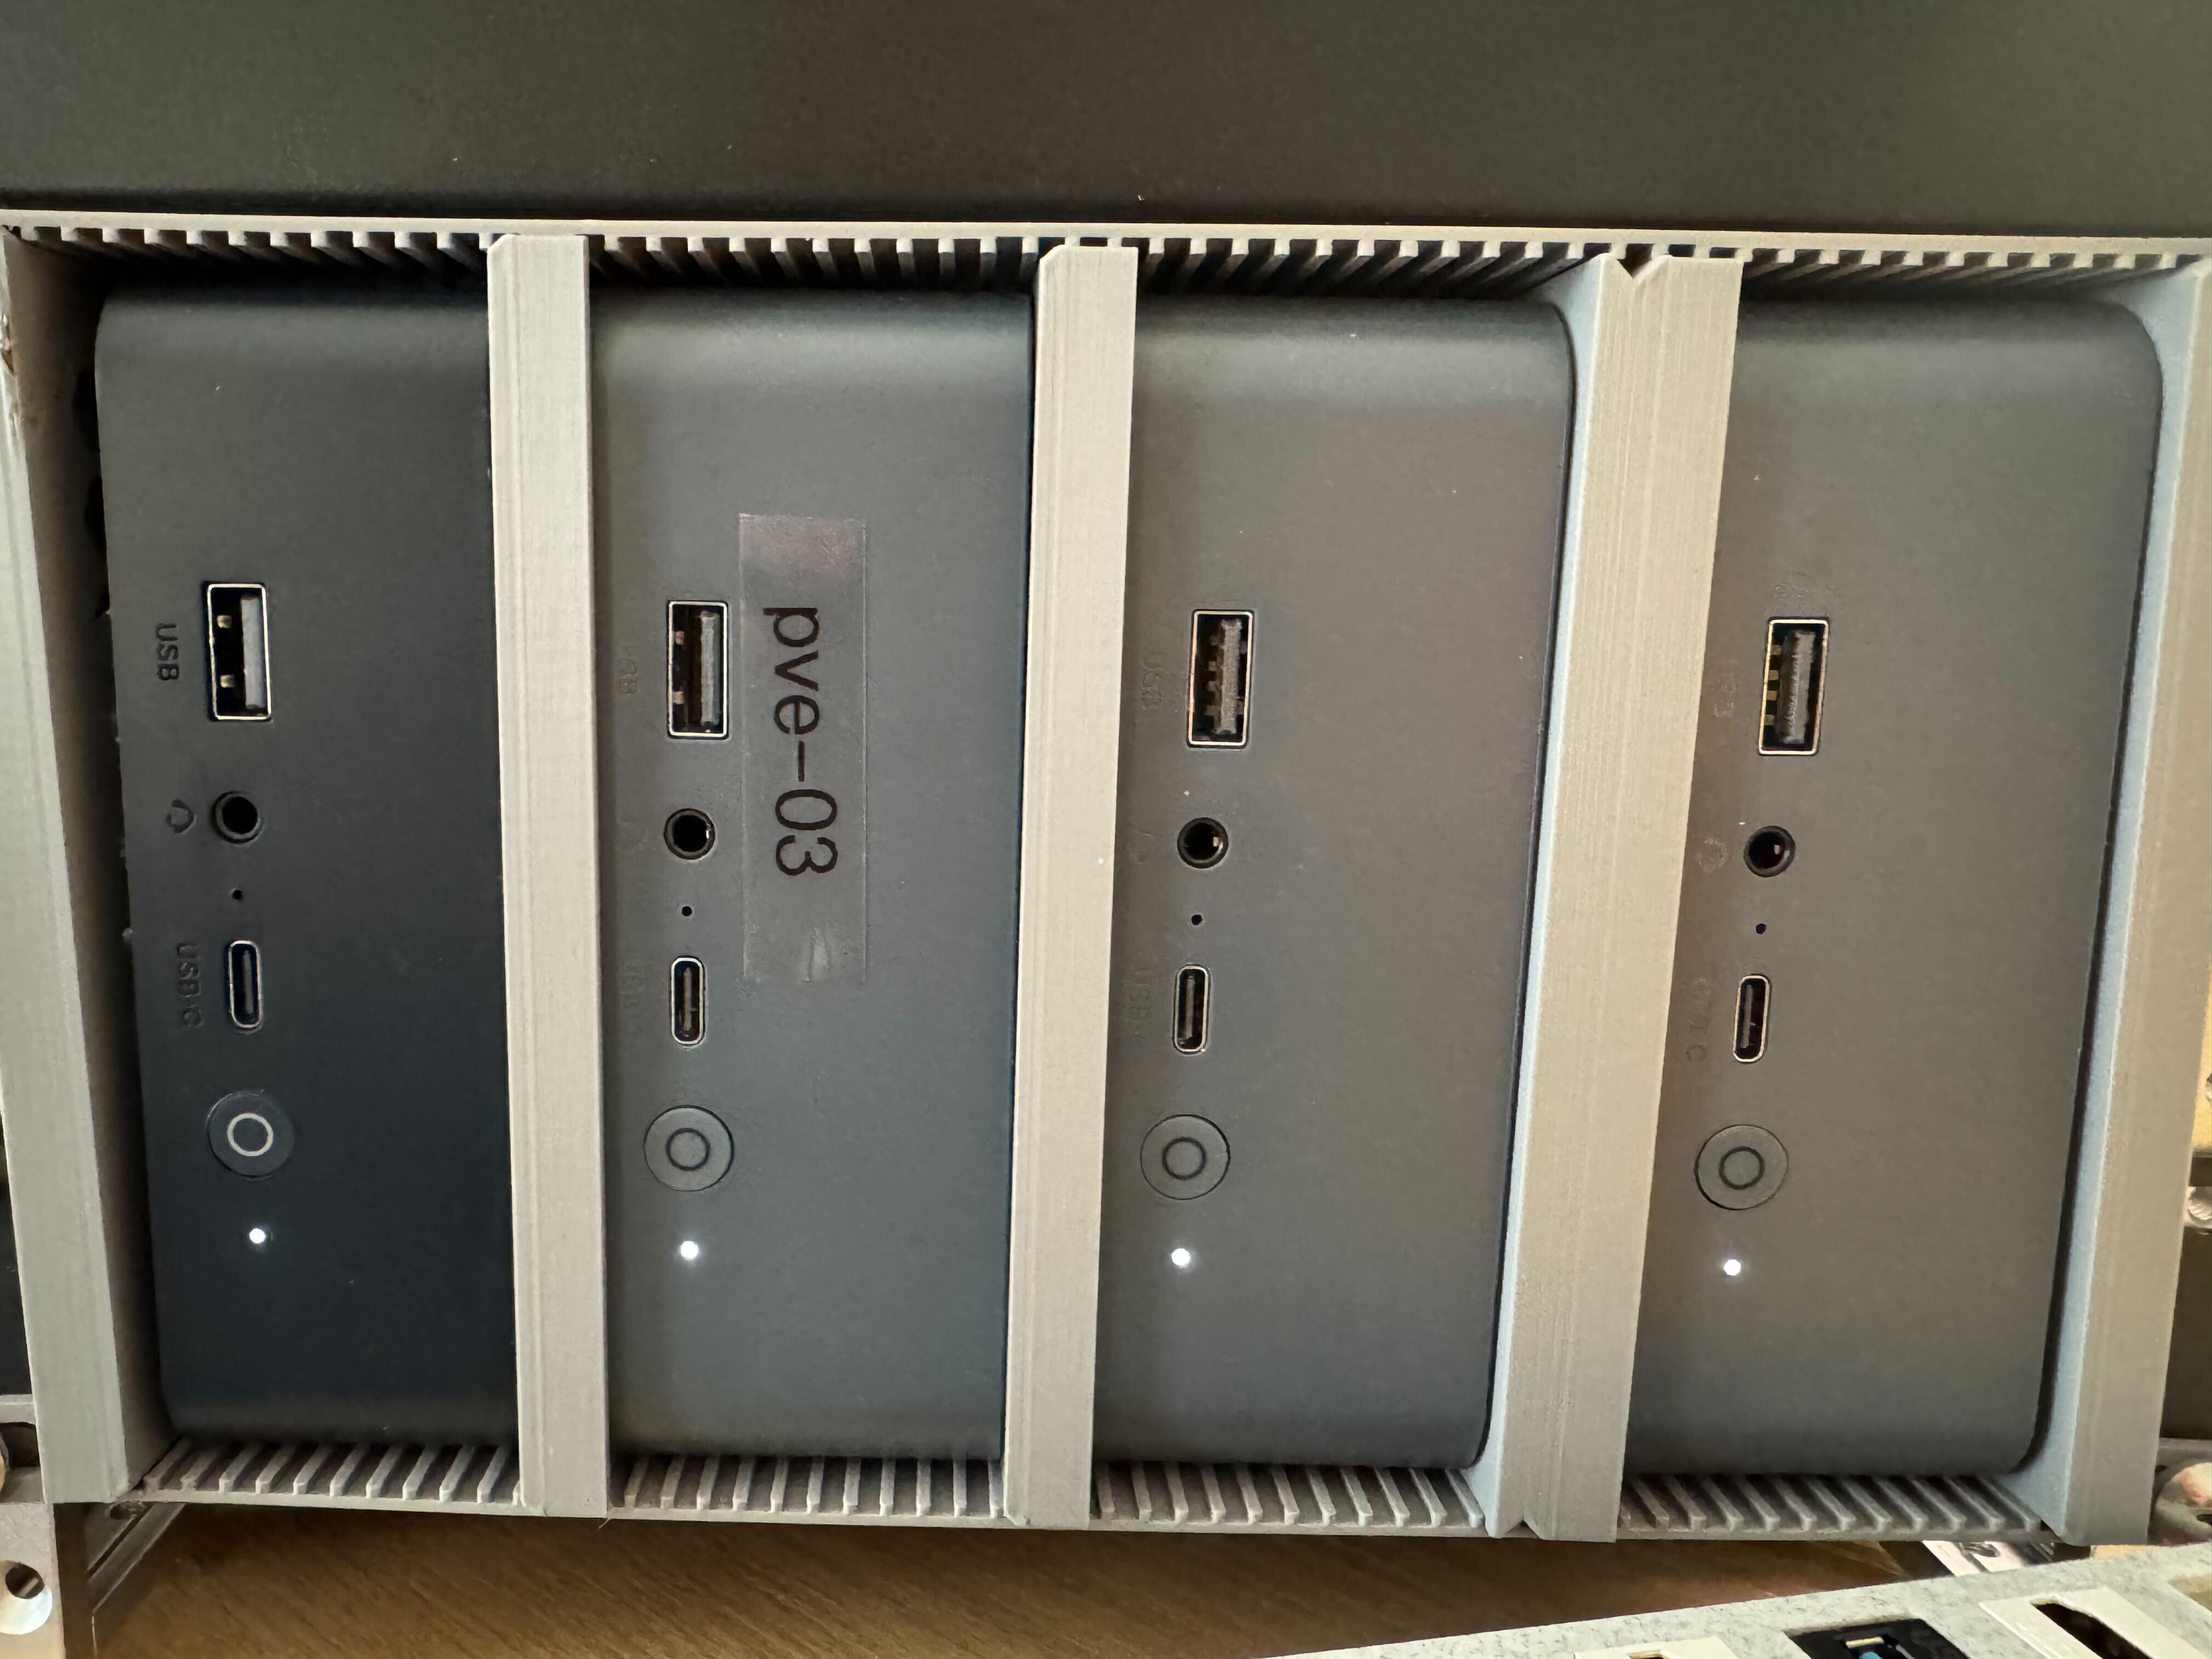
My homelab runs on a collection of MiniPCs—compact, power-efficient, and surprisingly capable. The infrastructure breaks down into three key “domains”. Effectively, I am acting as a “platform team” delivering a VM-hosting platform to two tenants: “Josh the developer” and “Josh the self hoster”:
Management & Control Plane
- Proxmox Datacenter Manager
- Proxmox Backup Server
- Containerized monitoring and management services
Personal Home Lab Services
- Data shares and NAS storage
- Containerized applications (third-party services)
- Production and staging environments
Development Sandbox
- Workstation VMs
- Build servers
- Containerized development services
- Ephemeral Kubernetes clusters for testing
The scale isn’t massive, but it’s enough to matter: 10 Proxmox hosts, and ~20 VMs at any given time. The Proxmox Hosts are all MiniPCs, most running 12th- or 13th-generation low-power CPUs like the N100 and i3 1330U.
Everything is managed through infrastructure-as-code:
- Ansible handles Proxmox node configuration
- NixOS manages VM deployments
This GitOps approach makes working with coding assistants remarkably productive—LLMs can read and modify configuration files directly, and git acts as a checkpoint before I actually apply changes.
Monitoring Goals Link to heading
My monitoring needs are fundamentally about infrastructure health:
- Are my Proxmox nodes healthy? CPU saturation, memory pressure, overall responsiveness
- Am I running out of disk space? Storage utilization across hosts and VMs
- Are any VMs misbehaving? Resource hogs, crashed services, unusual patterns
- Container issues: Debugging via SSH and journald logs
Nothing exotic—just the basics done well.
A Common Starting Point Link to heading
Most homelabs end up with something like this:
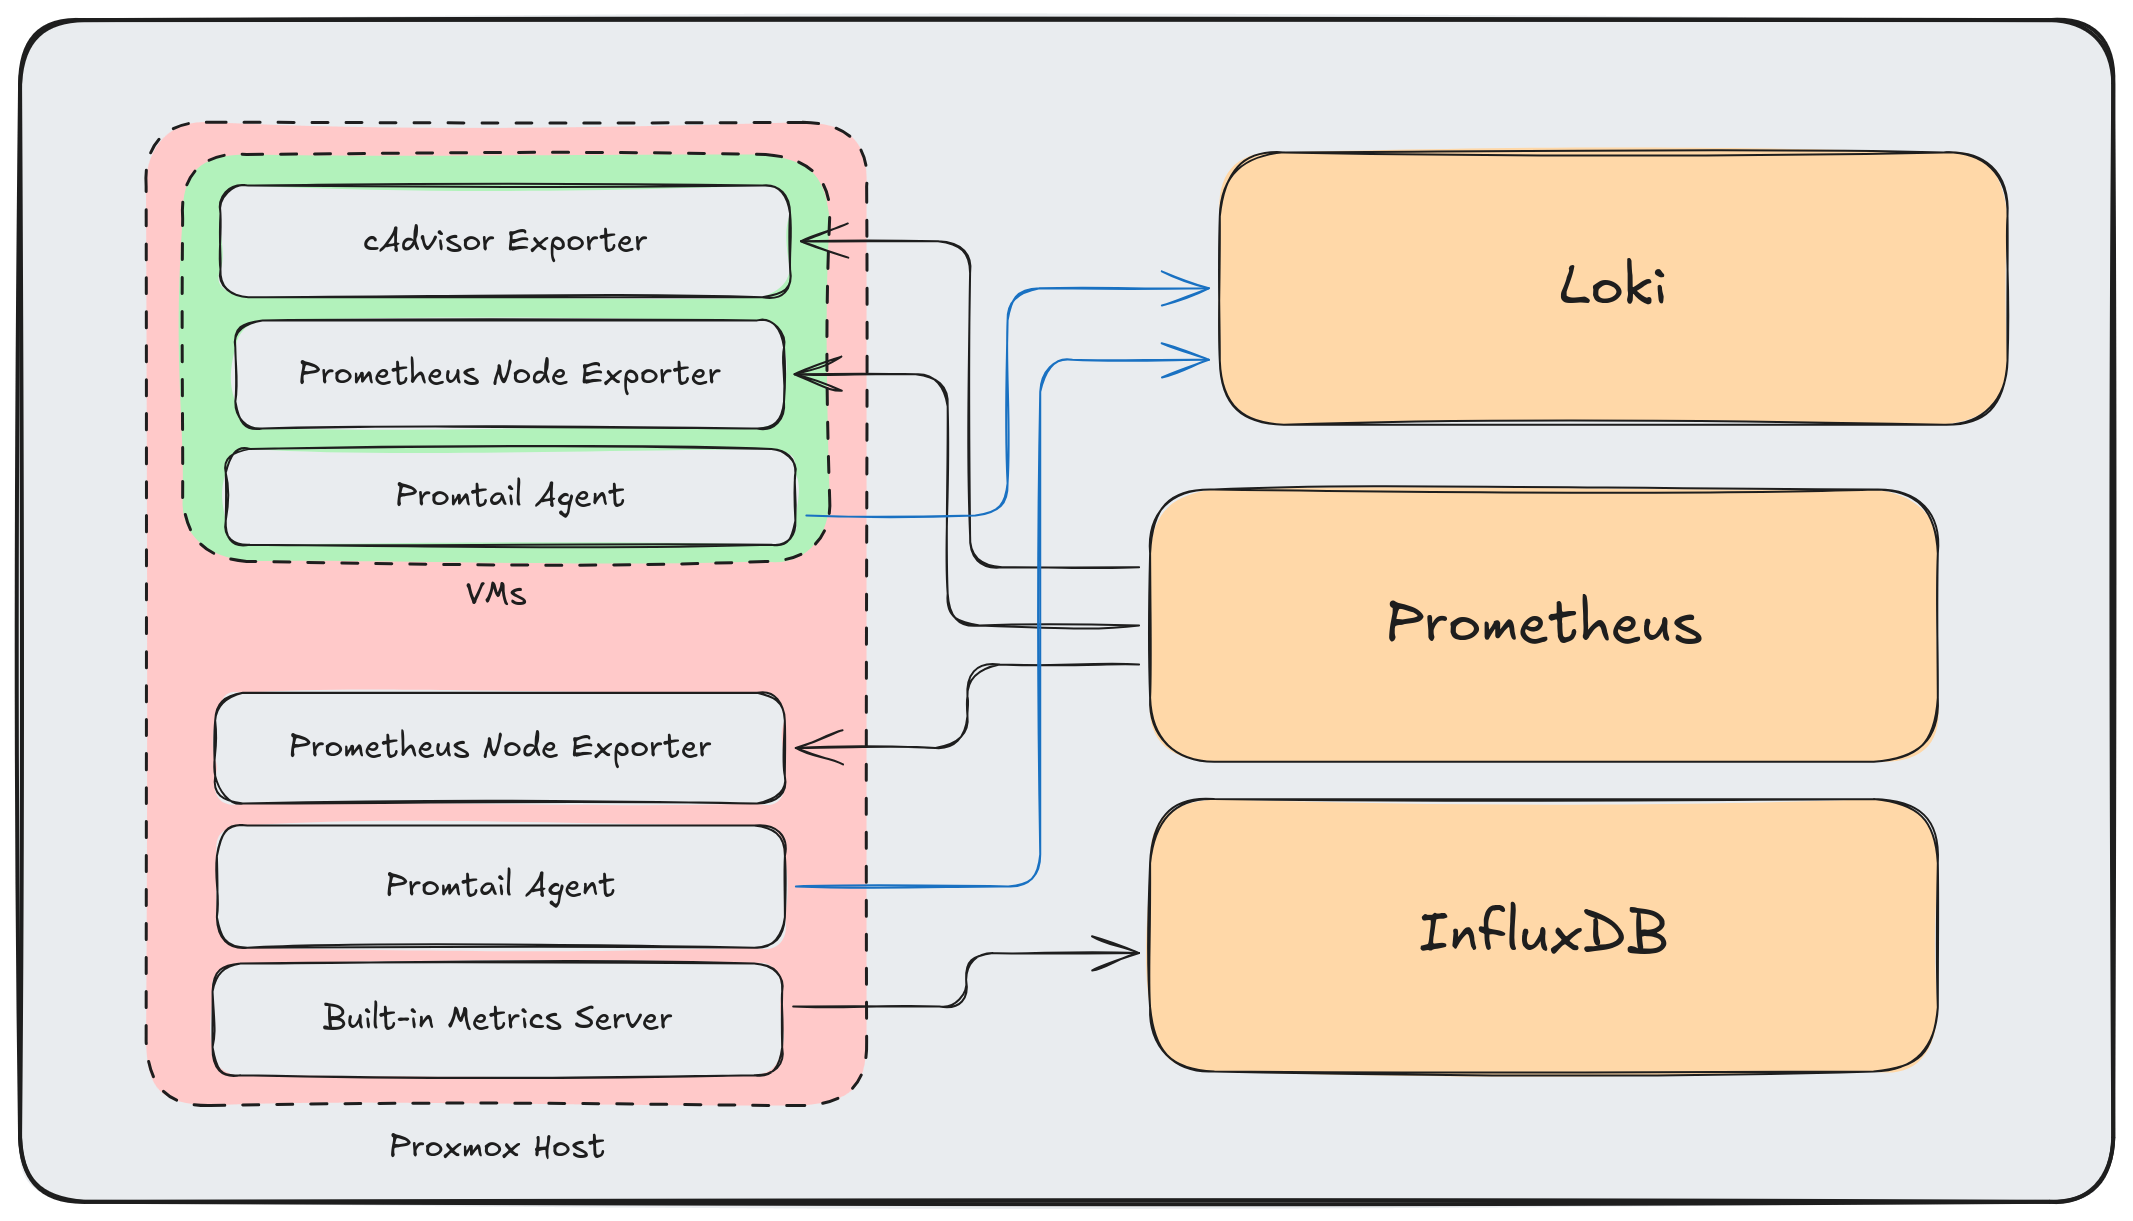
This is the standard approach: Prometheus exporters for metrics, Promtail for logs, and InfluxDB for Proxmox’s built-in metrics. It works—there are even ready-made Grafana dashboards for Proxmox clusters using InfluxDB.
But it has problems:
- Multiple agents per host consuming resources
- Different protocols and data formats everywhere
- No unified pipeline for processing or enrichment
- Adding new data sources means more point-to-point connections
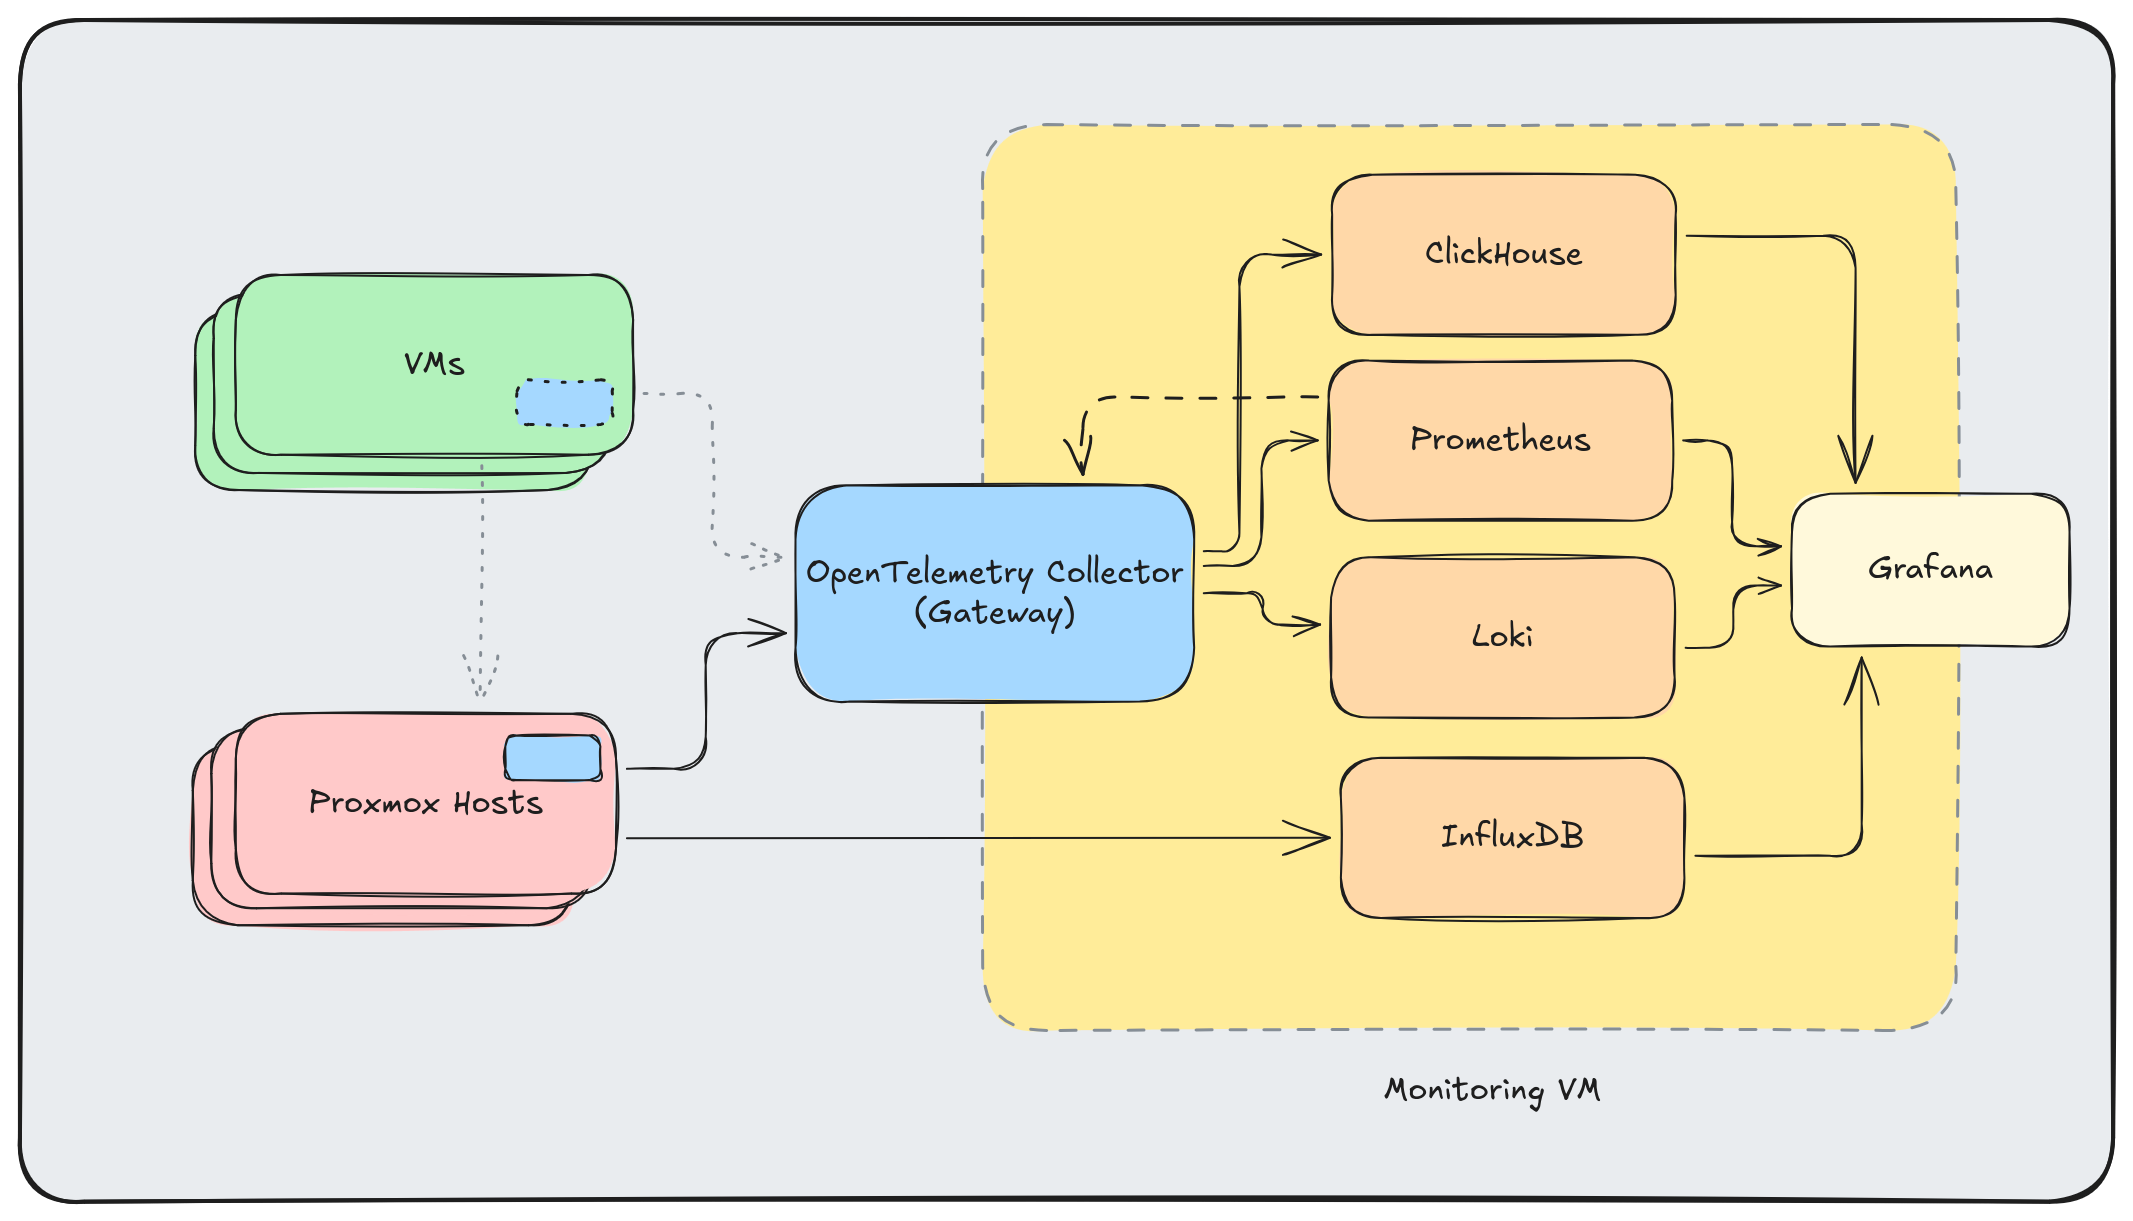
The Wrong Way to Add OpenTelemetry Link to heading
My first attempt at “improving” this was to layer OpenTelemetry on top:
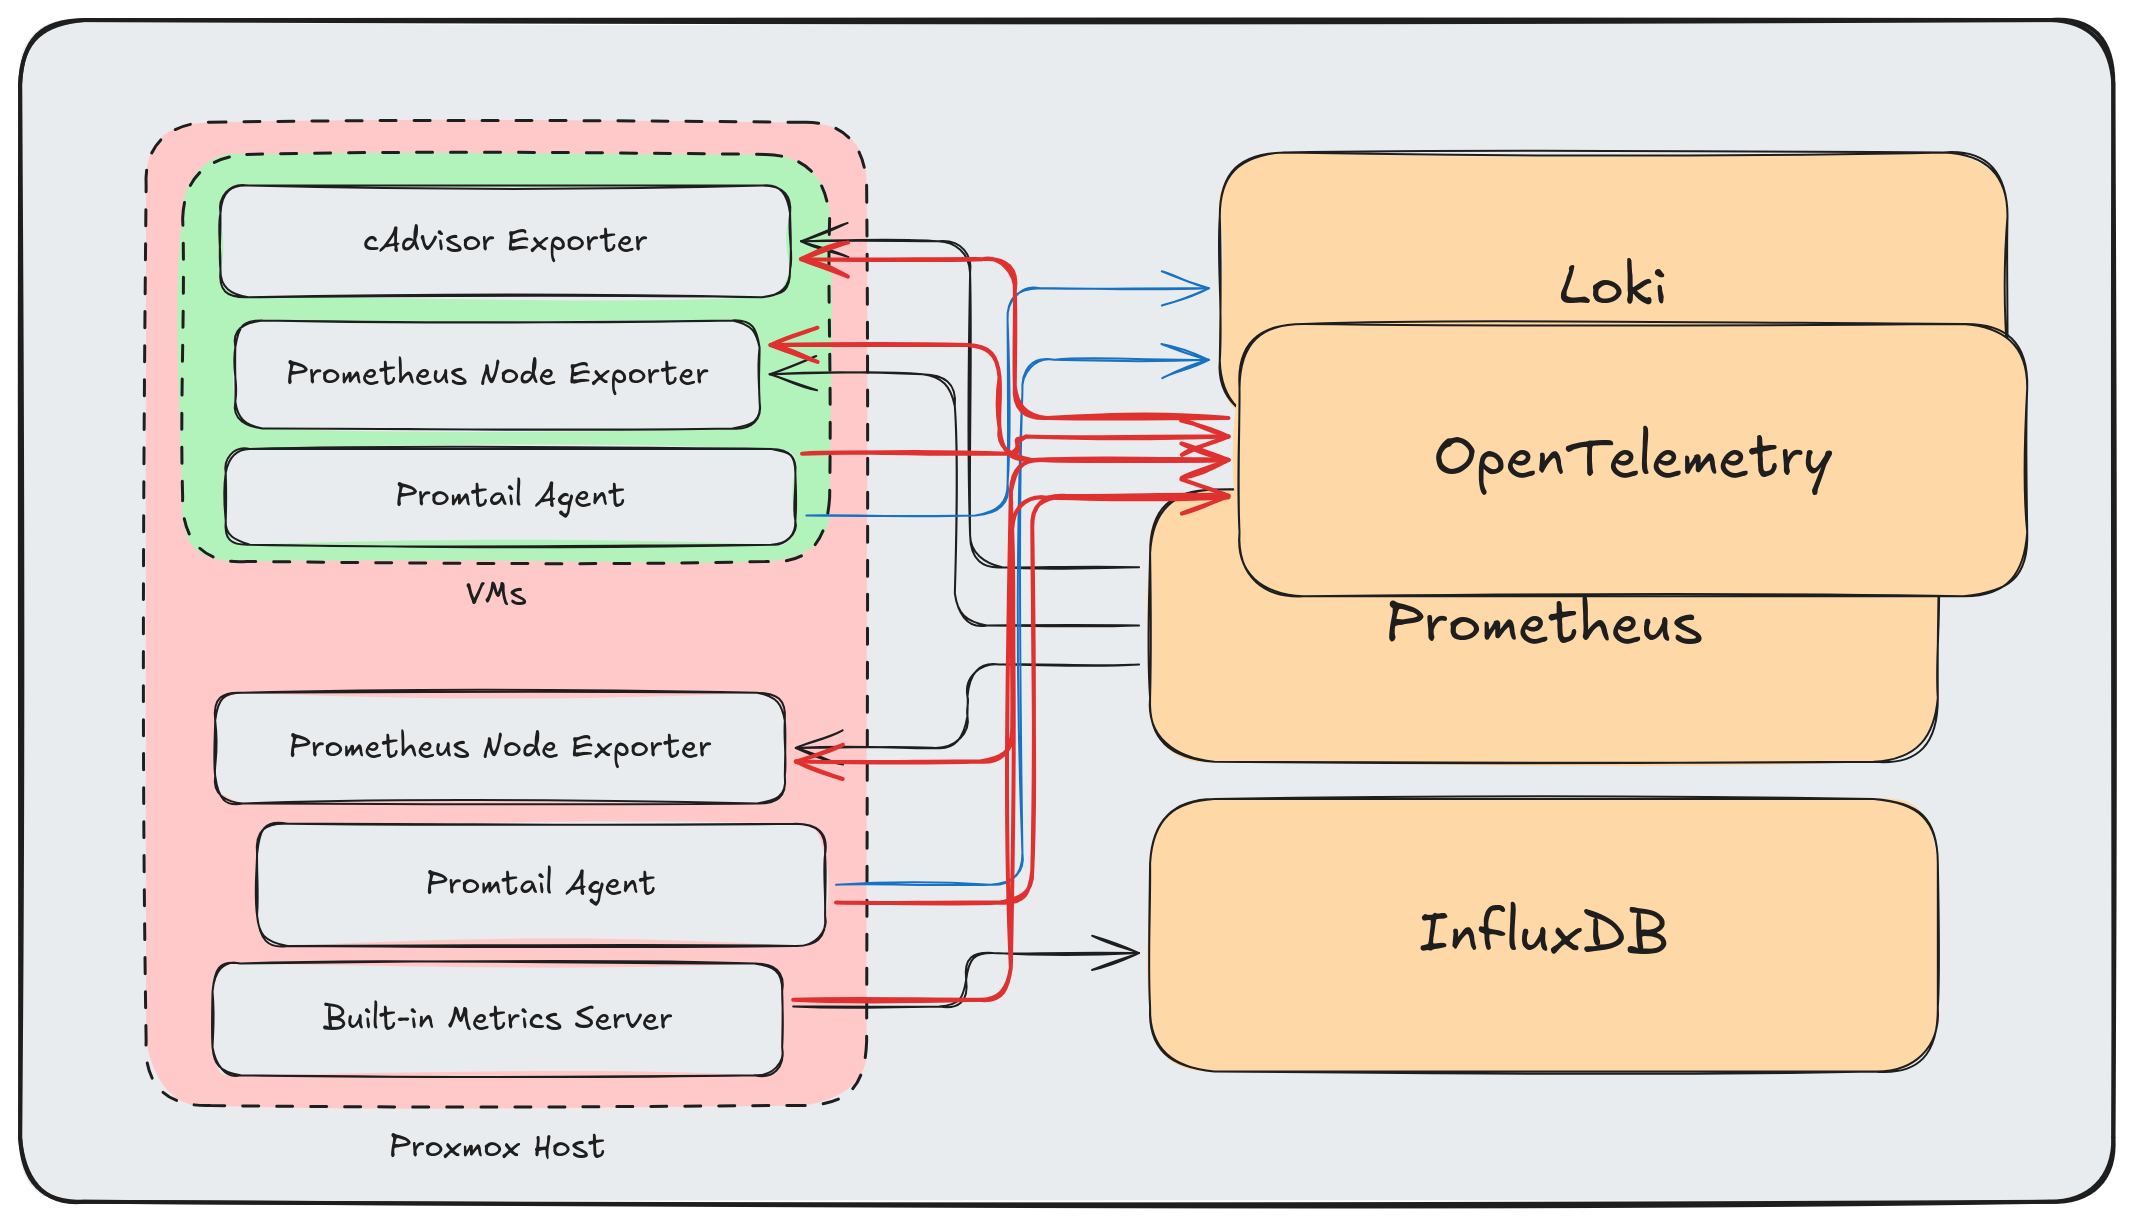
More arrows, more complexity, same problems. Adding OpenTelemetry as “another destination” misses the point entirely.
The OTel Way Link to heading
The OpenTelemetry Collector isn’t meant to be another endpoint—it’s meant to be the data plane. Every telemetry signal flows through it, and it handles all the protocol translation, processing, and routing.
Here’s a cleaned up view:
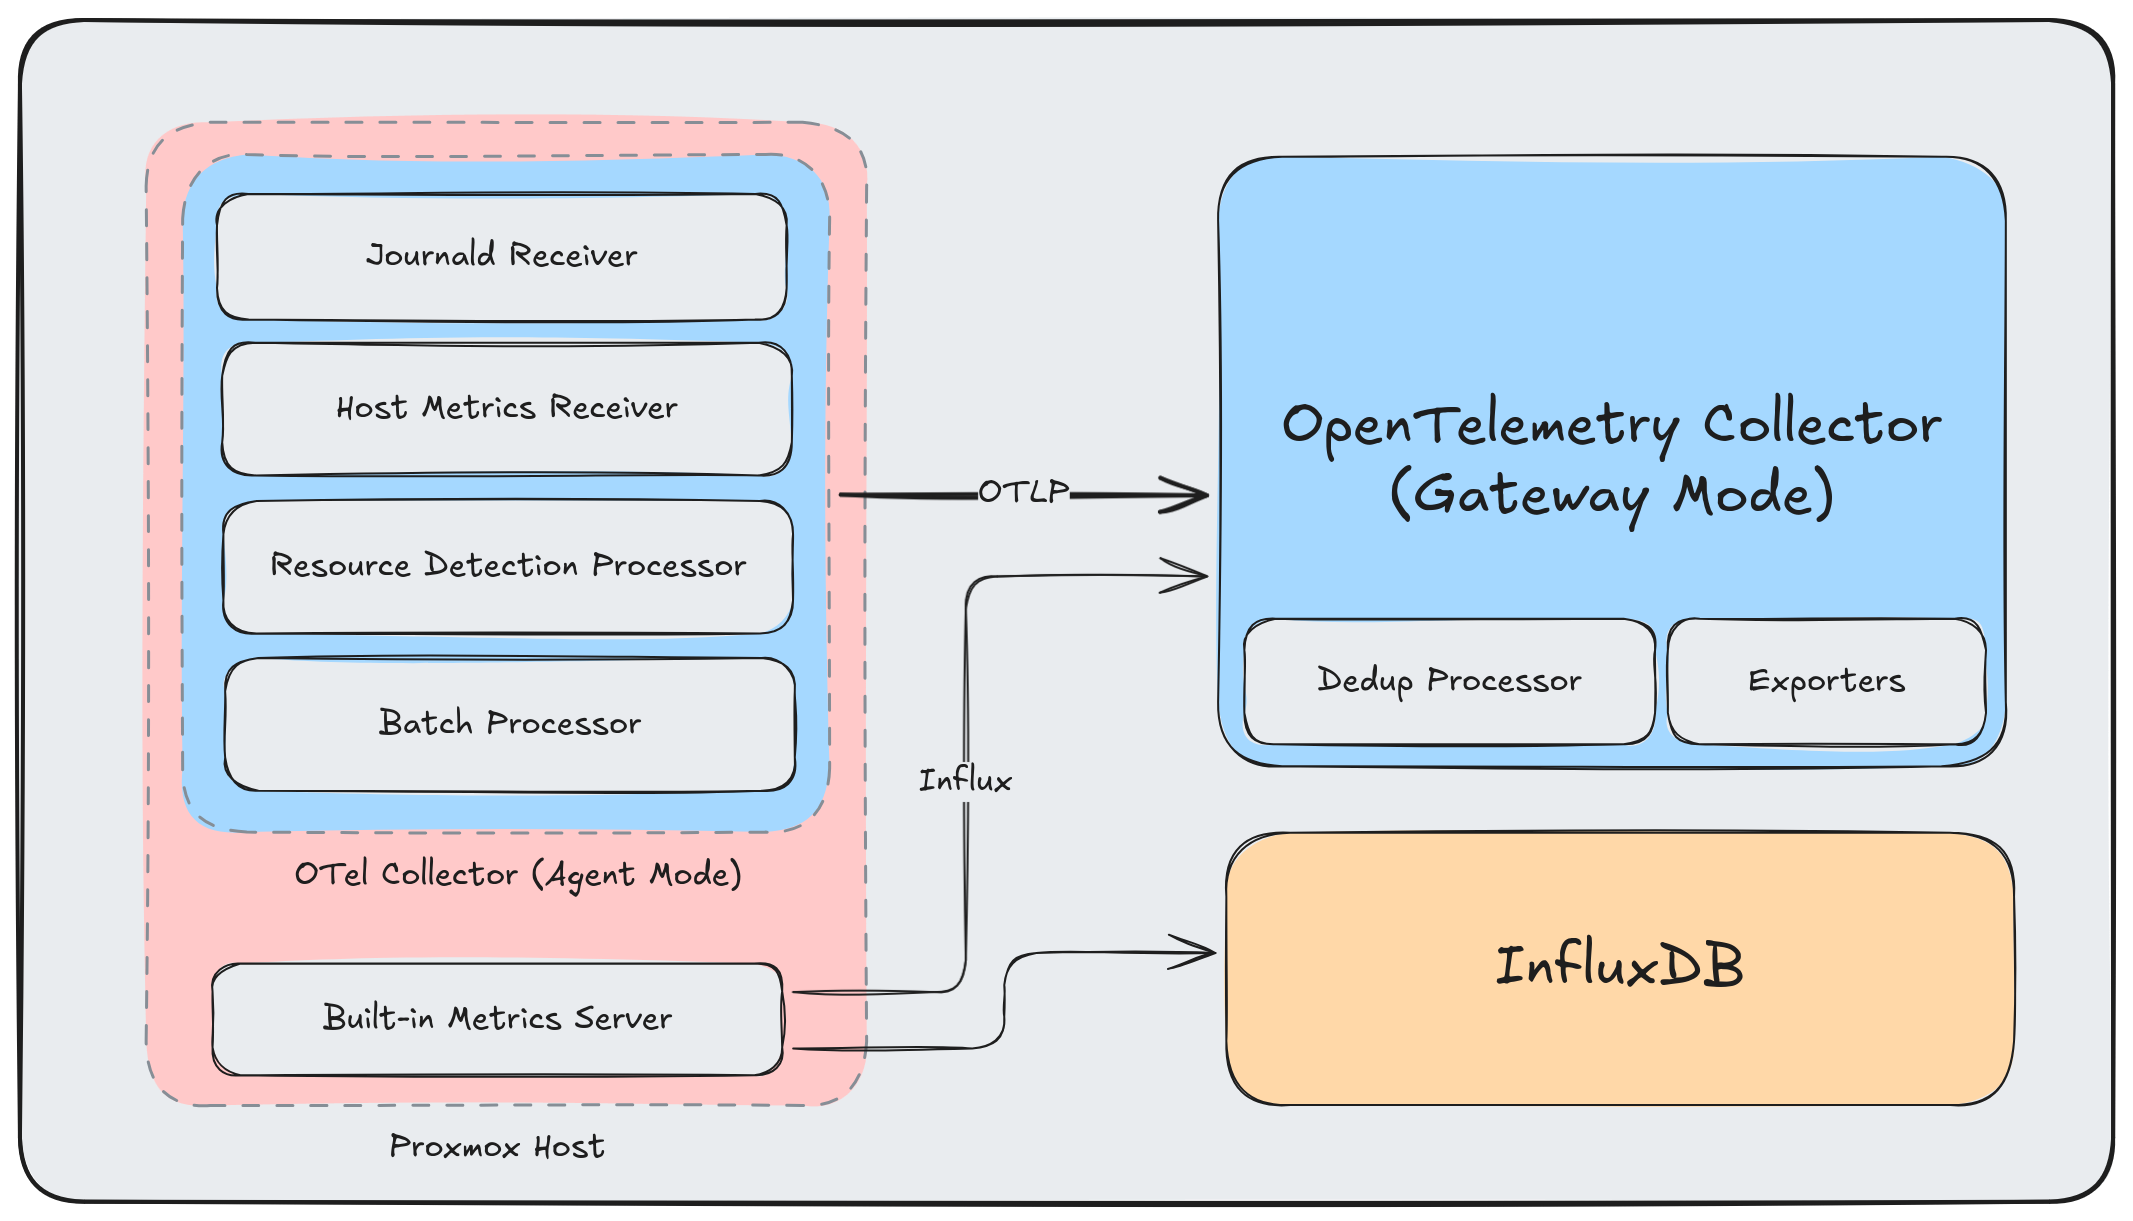
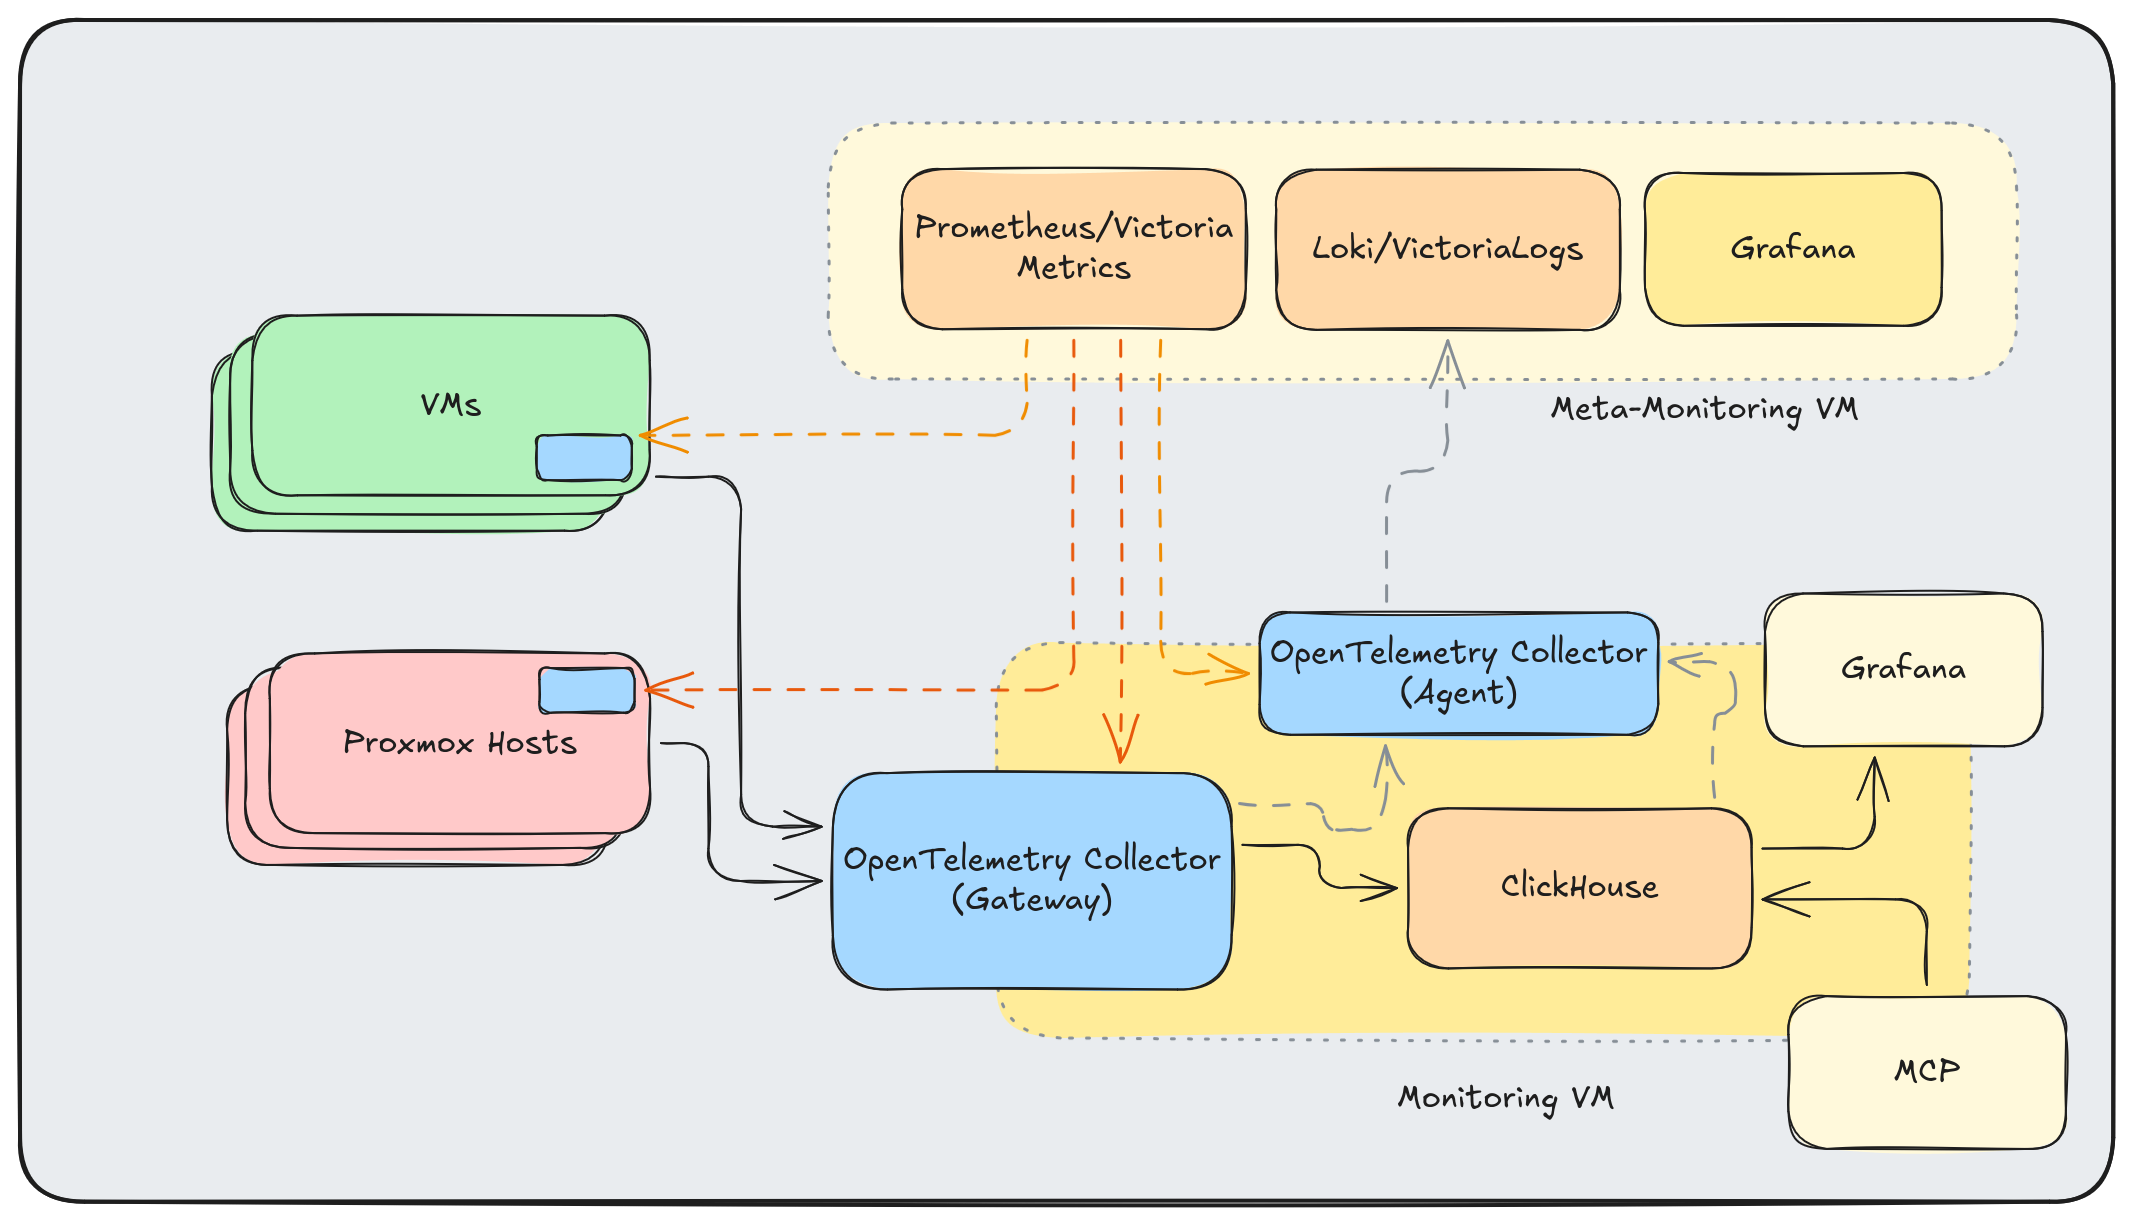
And here’s a complete overview of my current architecture:
I’m already running OpenTelemetry Collectors in both Agent and Gateway mode here, and I plan to add two other “types” of agents in the future.
The OpenTelemetry Collector Link to heading
A few things make the collector particularly suitable for homelabs:
Agent or Gateway: Run it lightweight on hosts (agent mode) or as a central aggregation point (gateway mode). Same binary, different configurations.
Container or Binary: Deploy as a Docker container or install the binary directly. I’m doing both.
Built-in Monitoring: The collector exposes its own metrics, so you can monitor your monitoring pipeline.
Don’t Use Contrib: The otelcol-contrib distribution includes everything and the kitchen sink. Build a custom collector with only the components you need using the OpenTelemetry Collector Builder. Smaller binary, faster startup, reduced attack surface.
Key Components Link to heading
The OTel Collector is infinitely expandable. Here are the components I’m using now or have used recently:
Receivers (data ingestion):
otlp: Native OpenTelemetry protocol from instrumented servicesinfluxdb: Accepts Proxmox’s built-in metrics without requiring InfluxDBjournald: Reads systemd journal logs directlyhostmetrics: CPU, memory, disk, network—everything node_exporter providessyslog: For legacy systems that speak syslog
Processors (transformation):
resourcedetection: Automatically detects and adds host metadatabatch: Buffers data for efficient exportlogdedup: Collapses repeated log messages (invaluable for noisy services)
Exporters (data output):
clickhouse: Long-term storage and SQL-based analysisprometheus: Exposes metrics for Prometheus scrapingotlphttp: Forward to Loki or other OTLP-compatible backends
Agent Configuration (Proxmox Hosts) Link to heading
Each Proxmox host runs a collector agent that gathers local telemetry:
receivers:
  journald:
    directory: /var/log/journal
    priority: info
    operators:
      - type: move
        from: body._HOSTNAME
        to: attributes.host_name
      - type: move
        from: body._SYSTEMD_UNIT
        to: attributes.systemd_unit

  hostmetrics:
    collection_interval: 30s
    scrapers:
      cpu:
        metrics:
          system.cpu.utilization:
            enabled: true
      disk:
      load:
      filesystem:
        metrics:
          system.filesystem.utilization:
            enabled: true
      memory:
        metrics:
          system.memory.utilization:
            enabled: true
      network:
      paging:
      processes:

processors:
  batch:
    timeout: 10s
    send_batch_size: 1024

  resourcedetection:
    detectors: [system]
    system:
      hostname_sources: ["os"]

  resource:
    attributes:
      - key: service.name
        value: "proxmox-host"
        action: upsert
      - key: deployment.environment
        value: "homelab"
        action: upsert

exporters:
  otlp:
    endpoint: "gateway.homelab:4317"
    tls:
      insecure: true
    retry_on_failure:
      enabled: true
      initial_interval: 5s
      max_interval: 30s

service:
  pipelines:
    logs:
      receivers: [journald]
      processors: [resourcedetection, resource, batch]
      exporters: [otlp]
    metrics:
      receivers: [hostmetrics]
      processors: [resourcedetection, resource, batch]
      exporters: [otlp]
I deploy via Ansible to all Proxmox hosts. The journald receiver pulls logs with structured metadata intact, and hostmetrics replaces node_exporter entirely.
Gateway Configuration Link to heading
The central gateway receives data from all agents plus Proxmox’s built-in InfluxDB metrics:
receivers:
  otlp:
    protocols:
      grpc:
        endpoint: 0.0.0.0:4317
      http:
        endpoint: 0.0.0.0:4318

  influxdb:
    endpoint: 0.0.0.0:8087

processors:
  batch:
    timeout: 1s
    send_batch_size: 1024

  logdedup:
    log_count_attribute: log_count
    interval: 10s
    timezone: UTC

exporters:
  clickhouse:
    endpoint: tcp://clickhouse:9000
    database: otel
    timeout: 5s
    retry_on_failure:
      enabled: true
      initial_interval: 5s
      max_interval: 30s

  prometheus:
    endpoint: 0.0.0.0:8889
    resource_to_telemetry_conversion:
      enabled: true

  otlphttp/loki:
    endpoint: http://loki:3100/otlp
    tls:
      insecure: true

extensions:
  health_check:
    endpoint: 0.0.0.0:13133

service:
  extensions: [health_check]
  pipelines:
    logs:
      receivers: [otlp]
      processors: [logdedup, batch]
      exporters: [otlphttp/loki, clickhouse]
    metrics:
      receivers: [otlp, influxdb]
      processors: [batch]
      exporters: [prometheus, clickhouse]
The InfluxDB receiver is the magic piece for Proxmox integration. I configure Proxmox to push metrics to the gateway’s InfluxDB endpoint, and the collector translates them into the OTel data model automatically.
Note that I’m using the otlp exporter for Loki - convergence on standard protocols is awesome!
Why ClickHouse? Link to heading
ClickHouse might seem like overkill for a homelab, but it earns its place:
- SQL queries: Complex analysis is just SQL. No learning PromQL edge cases.
- Compression: Columnar storage with aggressive compression. Months of metrics in gigabytes.
- Speed: Even on constrained hardware, analytical queries return instantly.
- Cardinality: Unlike Prometheus, high-cardinality labels don’t kill performance.
- Single binary: Easy to deploy and operate.
The OTel ClickHouse exporter creates tables automatically with a sensible schema for metrics, logs, and traces.
That being said, there are some reasons that you might not want to do this:
- Excessive wear on consumer SSDs
- More memory and storage overhead for small workloads
- No out-of-the-box dashboards available
Benefits of Staying Prometheus-Native Link to heading
That last point - no out-of-the-box dashboards - is one of the key arguments for using datasources “natively” without an OpenTelemetry Collector transforming the telemetry to “OTel Spec”. InfluxDB and Prometheus both have a wealth of Grafana dashboards available that expect the data to be in the “native” format of the agents from the respective ecosystems.
MCP: The Missing Piece Link to heading
However, Model Context Protocol (MCP) servers changes the game. Instead of trying to wire-up dashboards made by the community, I can use a coding assistant like Claude Code to rapidly iterate on dashboards - or even to query my data directly and skip the dashboard entirely. In particular, I’m enjoying:
- Grafana MCP: Query, update, and create Grafana Dashboards and Panels
- ClickHouse MCP: Query metrics and logs using natural language
- OpenTelemetry MCP: Inspect collector configurations and pipeline health
Combined with my Ansible inventory and NixOS configurations in the same repository, an LLM can correlate monitoring data with infrastructure definitions. “Why is pve-03 showing high memory usage?” becomes answerable with context about what VMs run on that host and their configurations.
It’s awesome. The LLM reads my infrastructure code, queries my monitoring data, and connects the dots.
Future Plans Link to heading
The architecture continues to evolve, and I have plans to make it even more robust in the future:
OTel Agents on VMs: I need to bring back monitoring of my VMs - specifically container logs and metrics.
High-Availability with Kubernetes: Right now if the gateway goes down, the otel upstream otel collectors will eventually run out of memory and discard telemetry. This can affect all exporters, even if only one destination is unavailable. I can resolve some of this by running the components in a highly available Kubernetes configuration.
Eliminate Dual Writes: I’ll eventually ditch the data being duplicated to Prometheus and InfluxDB, settling on ClickHouse for my main time-series data (and Prometheus for my meta-monitoring data from my OTel Collectors).
Meta-Monitoring Stack: A separate lightweight monitoring VM (Prometheus/VictoriaMetrics + Loki/VictoriaLogs) to monitor the monitoring stack itself.
Application-Specific Metrics: In a customer facing situation, “Requests flowing” is a good proxy for system health. For single-user homelab, I need different metrics to indicate end-user satisfaction:
- Immich: photos archived, storage growth
- Paperless: documents processed, OCR queue depth
- Proxmox Backup Server: successful backups in past 24 hours
The next step looks something like this:
Conclusion Link to heading
I love the flexibility and consistency that the OpenTelemetry Collector provides me, and I look forward to leveraging my gateway to experiment with more observability backends and stacks.
Further Reading Link to heading
- OpenTelemetry Collector Documentation
- OpenTelemetry Collector Builder
- ClickHouse Exporter
- ClickHouse MCP Server
- Proxmox External Metric Server
Altinity Resources Link to heading
- An Introduction to the OpenTelemetry Collector - Blog post covering the basics of the OTel Collector
- Deploying Single-Node ClickHouse on Small Servers - How to run ClickHouse on resource-constrained hardware
- Kubernetes Cluster Logging with the OpenTelemetry Collector - Webinar on collecting cluster logs with OTel
- Distributed Tracing with ClickHouse & OpenTelemetry - Webinar on tracing with ClickHouse as the backend
- O11y in One: ClickHouse as a Unified Observability Backend - Talk on using ClickHouse for all observability signals
- OTel in Practice: Homelab Monitoring slides - Slides for this blog post